Understanding how to measure performance is essential in any digital marketing strategy. Through my Google Digital Marketing certification, I gained hands-on experience with tools like Google Analytics to track website and campaign performance. I learned how to interpret traffic sources, user behavior, and conversion metrics to inform smarter marketing decisions. These skills have allowed me to create clear, actionable reports that help businesses understand what’s working, where to improve, and how to align marketing goals with measurable results.

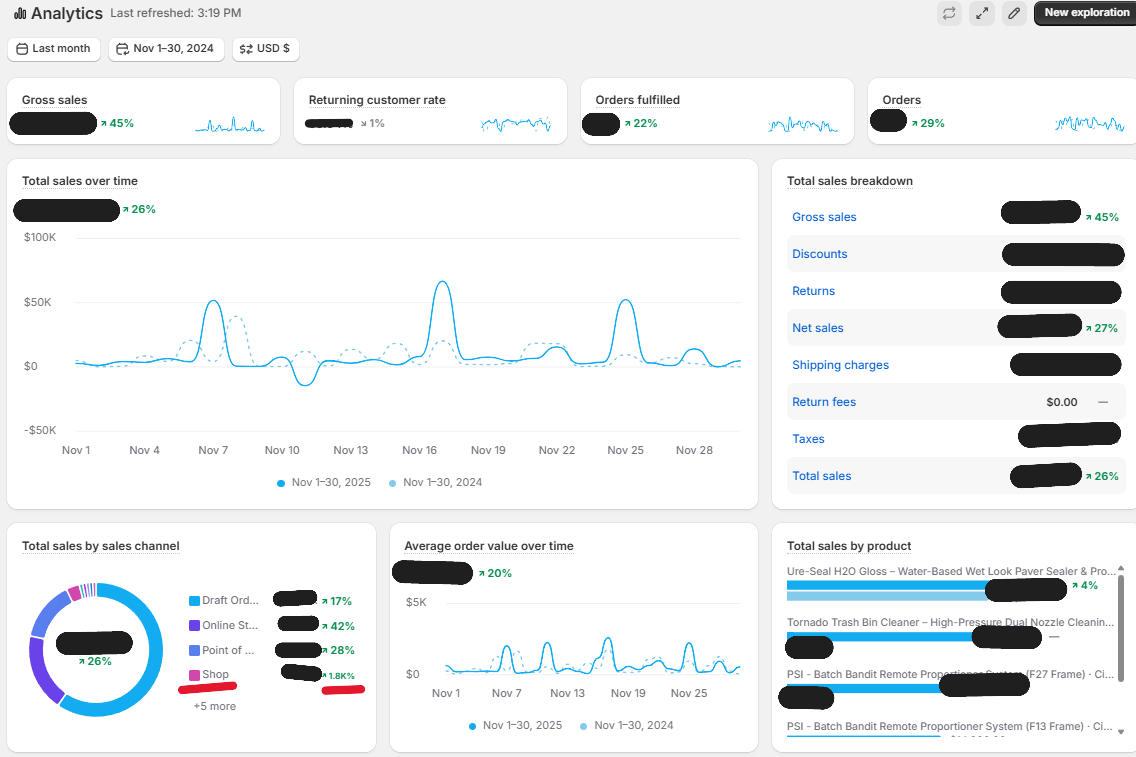
In November 2025, I led a multi-level awareness and traffic campaign that generated significant year-over-year growth for a Florida based Outdoor Equipment Company. Compared to November 2024, total sales increased by 26%, orders rose by 29%, and the returning customer rate remained relatively stable, which suggests that much of the growth came from new customers. My campaigns also drove a notable increase in store visits and product views, helping shift customer behavior across online, in-store, and Shop channels. All revenue figures are redacted for confidentiality, but the percentage increases reflect real performance gains directly aligned with my ad strategy.
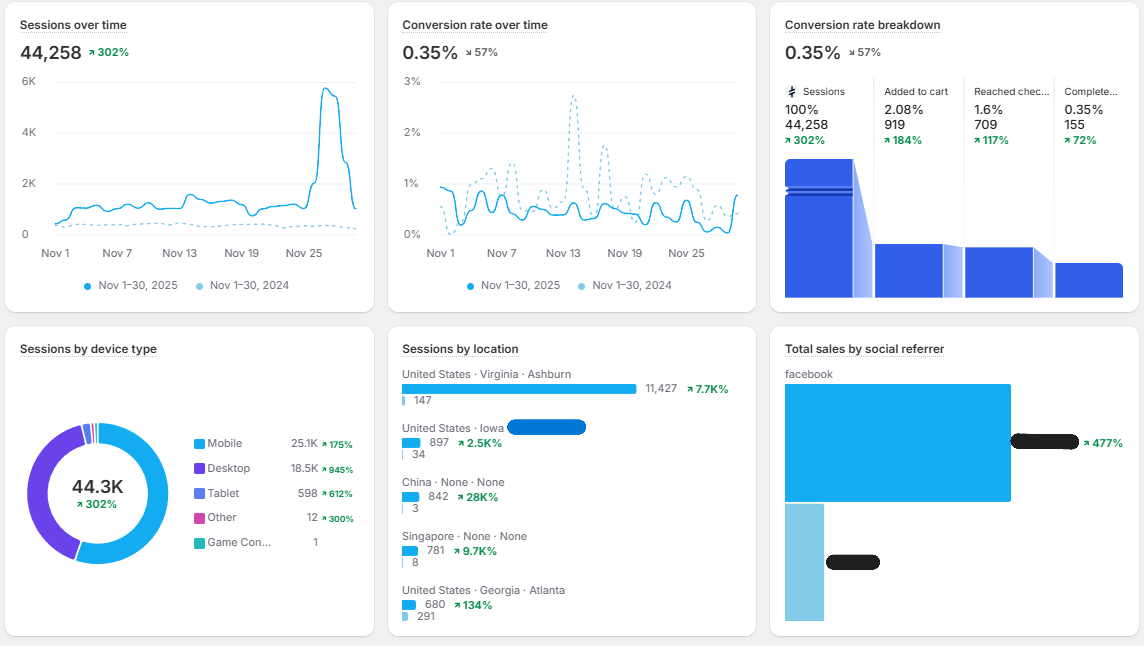
This next graphic highlights the site traffic results of that November 2025 awareness and traffic campaign, run on a modest $500 Facebook ad budget. Site sessions increased by 302%, significantly expanding audience reach. While the conversion rate percentage dipped—expected with large awareness campaigns—the number of buyers increased at every stage of the funnel, including a 72% rise in completed checkouts. U.S. sessions grew by over 7,700%, and Facebook-attributed sales climbed 447%, showing the campaign brought in high-quality traffic and a large volume of new customers despite the small budget.